The quantitative approach in trading requires one to be skilled in mathematics and statistics. It is mostly the price and volume that are the common input variables for conducting quantitative analysis for trading.
For instance, quantitative analysis implies testing the trading strategy with the past data (backtesting) for showing the strategy’s performance in terms of some popular performance statistical methods that include models such as ARIMA (Autoregressive Integration Moving Average), SMA (Simple Moving Average), Exponential smoothing, Neural Network (NN) etc. and the performance evaluations such as Sharpe Ratio, Sortino ratio etc. Understand how you can develop your skills by learning the implementations of neural network in trading.
The trading styles that use the quantitative approach are:
Going forward, this article includes:
- Reasons for using the Quantitative approach in each trading style
- How is the quantitative approach better than other approaches?
- How to start with quantitative trading?
Watch this video that explains Quantitative Trading and it's the fusion of mathematics, statistics, and finance, where traders use mathematical models and data analysis to make informed trading decisions.
Reasons for using the Quantitative approach in each trading style
The quantitative approach has some reasoning behind its success amongst traders for each trading style mentioned above and those reasons are:
- To capture short to medium term uptrends
- To be able to take quick actions
- For identifying the risks before investing
- For position sizing
- For contributing to investment banks and hedge funds with quantitative strategies
To capture short to medium term uptrends
To be able to trade successfully with the trading styles such as momentum, swing etc., one needs to capture short to medium uptrends. Quantitative analysis helps to spot the trading opportunities.
The quantitative analysis makes use of statistical methods such as Neural Network (NN), ARIMA (Autoregressive Integration Moving Average), SMA (Simple Moving Average) etc. to forecast the trend.
An example of moving average is below:
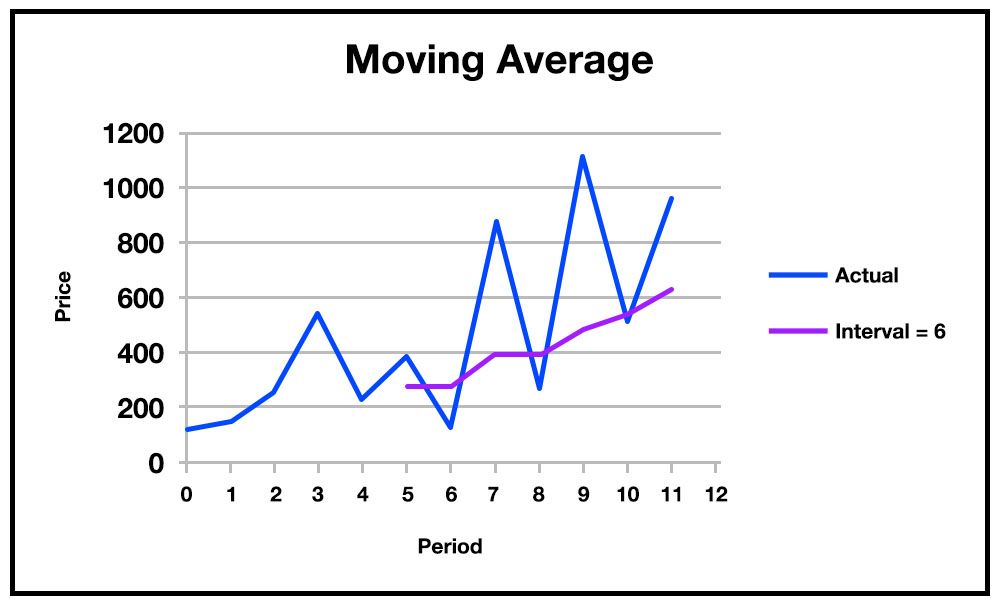
In the graph above, the price (12 observations) and the number of time period with the same interval are shown. The actual data points are reflected in blue, whereas SMA is calculated using the formula:
Added values till last time period(closing price)/ Total time period considered
The value for every next interval is calculated using the SMA formula. Hence, the purple line indicates the SMA which shows an uptrend. As you can see, between periods 5 & 6 there is a valley in the actual price. Then, from 6 to 7 a peak in the price is shown.
All in all, there are a lot of peaks and valleys in the graphical representation. SMA shows the trend on the basis of which the trader finds out whether there will be a bullish trend or a bearish trend. This is how with the help of statistical methods, a trader captures the short or medium term uptrend in the market and creates algorithms for buying during an uptrend and selling when the peak of the trend arises.
To be able to take quick actions
To be able to take quick actions with this systematic trading is yet another reason. In the case of quantitative trading, a trader spots a good amount of opportunities and then takes action regarding the execution of trades in the financial market.
Whether the trader wants the execution of trades to be manual or automated depends entirely on the trader. Whatsoever the case may be, the statistical methods bring some amount of certainty in the future value of the investment(s).
The automated system quickly opens and closes the position in the financial markets. However, with manual trading, the trader can quickly call the broker and place the order after the quantitative analysis is done through statistical methods.
These days, using a computer language, such as Python, has made it much faster than ever before to extract the past data, backtest the strategy with statistical calculations and execute the trade.
For identifying the risks before investing
With the help of calculations such as Sharpe ratio and maximum drawdown, a quant trader can identify the risks before investing the capital. With the calculations, a quant finds out the risks in the financial markets and also the opportunities on the basis of the same.
For instance, the Sharpe ratio measures the excess return per unit of standard deviation in an investment asset or a trading strategy. The higher the Sharpe ratio, the more return the investor is getting per unit of risk. The lower the Sharpe ratio, the less return an investor should expect on per unit risk.
For example, Suppose you expect that your portfolio has an annualized return of 12%. If the risk-free rate is 7% and your portfolio carries an 8% standard deviation. The Sharpe ratio for your portfolio would be calculated as:
Sharpe ratio = (Rp - Rf) / σ
Where,
Rp= Mean portfolio return
Rf= Risk-Free rate
σ= portfolio’s standard deviation
Sharpe Ratio = (12% - 7%)/ 8% = 0.625
Similarly, maximum drawdown can be expressed in the formula as :
Maximum drawdown = L-P/P
Where,
P = Maximum value before the largest drop
L = Lowest value before the new high
In your trading or investment period, your portfolio reduces in value multiple times. These reductions in value are known as drawdowns. The maximum of these drawdown values give us an estimate of the maximum a portfolio can go down. Technically, it is defined as the maximum value reduction from peak to trough for a portfolio.
For Example:
Let’s say your portfolio has an initial value of $10,000. It increases to $50,000 over a period of time, before falling to $7500. It then rebounds to $55,000, before falling again to $48,000.
The maximum drawdown, in this case, is
(7500 – 50000) / 50000 = -85%.

You can compare two portfolios with these performance evaluation methods and can pick the one with a higher Sharpe ratio and lesser maximum drawdown values when compared to the other.
For position sizing
To maintain your portfolio, position sizing is extremely important. Position sizing determines the size of the position as to how many shares, contracts, bonds, etc. should be purchased and sold for each trade. With the quantitative approach, you can analyse the performance of the strategy with the techniques such as optimal f, Kelly etc. (Learn position sizing in trading in detail in the Quantra course).
For getting employed in investment banks and hedge funds with quantitative strategies
Quantitative traders are usually employed by investment banks and hedge funds. Some commercial banks also employ quants. Quants can work in the front office and back office for the hedge funds and investment banks such as Bridgewater Associates, Goldman Sachs etc. If you're specifically interested in pursuing hedge fund positions, our detailed guide on how to get a job at a hedge fund provides step-by-step preparation and application strategies
The quants in the back office conduct the research, create trading strategies, and do the risk management. Also, back office quants are into validating the models created on the basis of trendlines, stock value etc. whereas, front office quants are more focussed on implementing and executing the trading strategies.
How is the quantitative approach better than other approaches?
Quantitative trading, when compared with traditional and non-quantitative approaches of trading, is useful because its results are more specific in nature.
|
Quantitative trading |
|
It is an objective analysis to quantify the data |
|
Data is analysed with the help of performance evaluation metrics such as Sharpe ratio, Sortino ratio, Maximum drawdown, and models such as ARIMA, SMA, etc. |
|
The analysis quantifies the data on the basis of the occurrence of a particular situation in the past |
|
It covers a large dataset |
|
Research methodology is conclusive in numbers |
|
Traditional trading and non-quantitative approaches |
|
Do not quantify the data |
|
Work on trend or pattern analysis only and not on numbers |
The data is usually not very large since it is difficult to test a large dataset without a quantitative approach |
|
Decisiveness is not as great since the strategy can not be measured and can only be predicted seeing the data values |
|
Research methodology is conclusive without the exact numbers or measurement |
|
Emotions are usually not controlled in case of non quantitative approach |
How to start with quantitative trading?
To begin with quantitative trading, we have comprehensive blog articles, Quantitative Finance Courses, and some interesting videos for assisting you.
Resources to learn Quantitative Trading
Blogs to learn Quantitative Trading
The blog articles cover subtopics ranging from educational background to professionally becoming a quant and exploring various quant jobs and job roles. Following are the recommended quant blog:
Videos to learn Quantitative Trading
The following videos will take you through in-depth knowledge of quant trading strategies:
Quantitative trading generally consists of research and the formation of hypotheses based on mathematical and statistical models rigorous backtesting of the strategy execution of the trades and finally managing risks. This video offers a brief introduction of the course Quantitative Trading Strategies and Models to help you start your journey!
- How quant trading strategies are developed and tested
- Introduction to swing trading strategies
- Introduction to momentum trading strategies
- Algorithmic trading strategies for scalping
Courses to learn Quantitative Trading
The following courses will build your knowledge and skills for quantitative trading strategies or trading styles:
- Swing trading strategies
- Momentum trading strategies
- Day trading strategies
- Options trading strategy in Python
Conclusion
A quantitative approach to trading allows you to capitalize on opportunities in the financial markets. The opportunities are found out by breaking down the complex behavioural patterns into numerical values.
To take more calculative risks in the financial markets, a mathematical and statistical approach helps provide some firm expectations from a trading decision.
Explore our course on Momentum Trading Strategies for learning more. You can also check out our blog on Momentum Trading.
Disclaimer: All data and information provided in this article are for informational purposes only. QuantInsti® makes no representations as to accuracy, completeness, currentness, suitability, or validity of any information in this article and will not be liable for any errors, omissions, or delays in this information or any losses, injuries, or damages arising from its display or use. All information is provided on an as-is basis.