By Varun Divakar
Natural Language Processing or NLP is used extensively in trading. It is mainly used to gauge the sentiment of the market through Twitter feeds, Newspaper Articles, RSS feeds and Press releases. In this blog, we will cover the basic structure needed to solve the NLP problem from a trader’s perspective.
Trading and NLP
Anyone who has traded some sort of a financial instrument knows that the markets constantly factor in all the news that is pouring in through various sources.
The cause and effect relationship between impactful news and market movements can be directly observed when one tries to trade the market during the release of big news such as the non-farm payrolls data.
News and NLP
Before social media became one of the main sources of information, traders used to depend on the Radio or TV announcements for the latest information.
But since Twitter became a source of market-moving news (thanks to political leaders), traders are finding it difficult to manually track all the information originating from different twitter handles. To circumvent this problem, traders can use NLP packages to read multiple news sources in a short amount of time and make a quick decision.
If you are a trader then you should definitely learn how to use NLP in trading, to outperform other traders. Now I am going to list out in a step by step manner how you can approach the problem of using NLP in trading and discuss each of them in detail.
Steps for using NLP in trading
Following are the steps that one needs to follow for using NLP for Trading.
- Get the data
- Preprocess the data
- Convert the text to a sentiment score
- Generate a trading model
- Backtest the model
Get the data
To build an NLP model for trading, you need to have a reliable source of data. There are multiple vendors for this purpose.
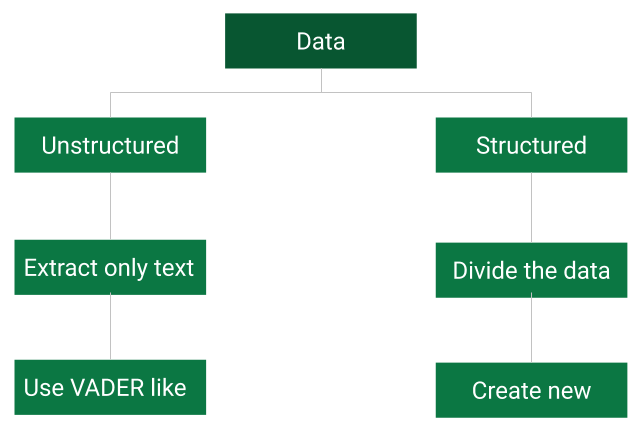
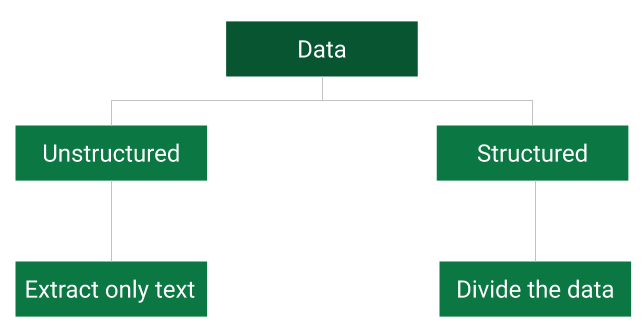
For example, Twitter and Webhose provide it for free, while others such as News API, Reuters and Bloomberg will charge you for it. Let us divide the data into two types and try to approach each of them differently. 
Structured data is one that is published in a predetermined or consistent format. The language is also very consistent.
For example, the press release of fed minutes or a company’s earnings can be considered as structured data. Here the length of the text is usually very huge.
On the contrary, unstructured data is one where neither the language or format is consistent. For example, twitter feed, blogs and articles can be counted as a part of this. These texts are usually limited in size.
Preprocess the data

There are different problems associated with these two data sets. Unstructured data like Twitter feeds consists of many non-textual data, such as hashtags and mentions. These need to be removed before measuring the text’s sentiment.
For structured data, the size of the text can easily cloud its essence. To solve this, you need to break the text down to individual sentences or apply techniques such as tf-idf to estimate the importance of words.
Convert the text to a sentiment score

To convert the text data to a numerical score is a challenging task. For unstructured text, you can use pre-existing packages such as VADER to estimate the sentiment of the news. If the text is a blog or an article then you can try breaking it down for VADER to make sense of it.
For Structured text, you don't have any pre-existing libraries that can help you convert the text to a positive or a negative score. So, you will have to create a library of your own.
When building such a library of relevant structured data, care should be taken to consider texts from similar sources and the corresponding market reactions to this text data.
For example, if the Fed releases a statement saying that “the inflation expectations are firmly anchored” and changes it to “the inflation expectations are stable”, then libraries like VADER won't be able to tell the difference apart, but the market will react significantly.
To understand score the sentiment of such text you need to develop a word-to vector model or a decision tree model using the tf-idf array.
Generate a trading model
Once you have the sentiment scores of the text, then combine this with some kind of technical indicators to filter the noise and generate the buy and sell signals.
To generate these signals, you can either do it manually from your experience or use a decision tree type model.
Backtest the model
Once the model is ready, you need to backtest it on the past data to check whether your model’s performance is within the risk limitations. While backtesting, make sure that you don't use the same data that is used to train the decision tree model.
If the model confirms to your risk management criterion then you can deploy the model in live trading.
Conclusion
In conclusion, you can say that the task of quantifying the market sentiment needs meticulous research and genuine resources. That is why we at Quantra have created a course to help you deploy a Twitter-based Sentiment model on Interactive Brokers’ TWS.
If you wish to develop your career in modern methods in finance, be sure to check out this course on Sentiment Analysis for finance. It covers various aspects of trading, investment decisions & application using News Analytics, Sentiment Analysis and Alternative Data.
Disclaimer: All investments and trading in the stock market involve risk. Any decisions to place trades in the financial markets, including trading in stock or options or other financial instruments is a personal decision that should only be made after thorough research, including a personal risk and financial assessment and the engagement of professional assistance to the extent you believe necessary. The trading strategies or related information mentioned in this article is for informational purposes only.


