By Vibhu Singh
Would you want a place where you can learn, backtest, optimise and trade market strategies, all in one place?
Wouldn't such a place be heaven for trading enthusiasts?
Quantra attempts to do precisely that. At Quantra, you can learn different trading strategies ranging from momentum trading strategies to mean reversion strategies, day trading strategies and even machine learning strategies.
You can also analyse and optimise the strategy's performance, and once you are satisfied with the performance, with one-click integration feature, you can take your strategy live.
In this blog, you will learn to create a simple trading strategy based on machine learning, implement the same strategy in live markets through Quantra platform with one click and analyse the strategy performance.
This article covers the following topics:
- What is Machine Learning?
- Build a Simple Machine Learning Strategy
- Live Trade on Blueshift through Quantra
- Analyse the Performance of the Strategy
What is Machine Learning?
Machine Learning is a subset of artificial intelligence which provides machines with the ability to learn autonomously based on experiences, observations and patterns without being explicitly programmed. We input a data set through which the machine learns and builds a model to make the predictions and decisions.
Let’s understand how to use machine learning in trading.
Let’s say you have a machine learning algorithm with all the intelligence. This algorithm can be as simple as linear regression, support vector classifier or as advanced as deep neural networks. Equip yourself with advanced skills and learn about the applications of neural network in trading.
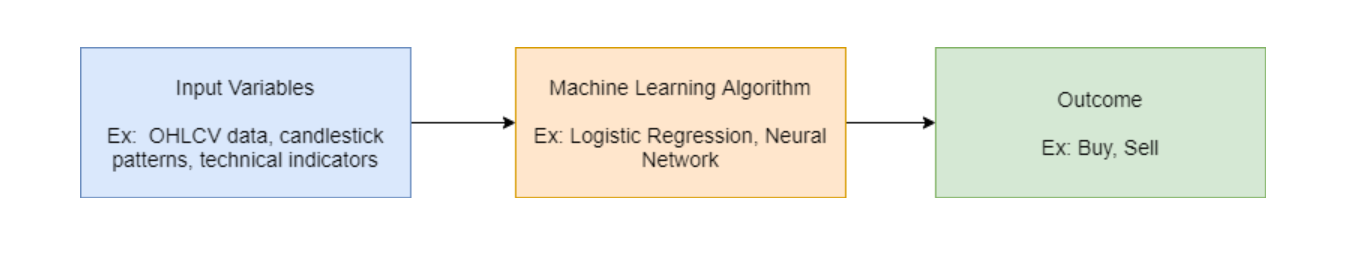
The next thing which you need to decide is what you want from the machine learning algorithm. The typical outcome of the machine learning algorithm in trading would be to find the points to enter and exit the position.
In simple words, when to buy or sell and when to exit the open position. Another outcome would be the number of shares to buy/sell or the price at which to buy/sell.
You have defined your machine learning algorithm and defined the outcome. But how does the algorithm achieve that outcome?
This requires data, or in more sophisticated language, you can say it as a feature which will help ML algorithms to predict the outcome.
This is one of the most important and time-consuming parts of any machine learning algorithm. Some examples of features are historical prices such as OHLC data, candlestick patterns, time of the trade, technical indicators or fundamental data such as price to earnings ratio.
To summarise, you pass the features or data to the machine learning algorithm, and it will predict the outcome defined by you.
Let’s use this concept to build a machine learning trading strategy to predict the next day’s movement of S&P 500.
Build a Simple Machine Learning Strategy
Import libraries and packages
The first step in designing and creating an ML strategy is importing libraries and packages which you will be required to use. Some of the commonly used libraries are:
- Pandas and Numpy for data reading and manipulation.
- Matplotlib is another popular Python library used for plotting purposes.
- Sklearn is one of the most popular machine learning libraries for the Python programming language.
If you are not aware of libraries that you will use in the strategy creation process, you can also import these libraries on the need basis and not at once.
Read stock data
The next step is to read data. Our task is to predict the price movement of S&P 500. So to create features we need to read S&P 500 data. The data is available in the csv file to download at the end of this blog. You can also get the stock market data such as price, volume and fundamental data using Python packages.
Create input features
This is the most exciting and essential part of any machine learning algorithm. Here in the strategy, for simplicity, we created features from historical prices of S&P 500.
We created two features which are the difference between open and close and high and low prices. We will pass these features into a machine learning algorithm for prediction.
You can also use technical indicators and other features according to your need. Input features are also known as predictor or independent or explanatory variables.

Define target variable
The target variable is the outcome which the machine learning model will predict based on the input features. Here the target or outcome is straightforward. If tomorrow's price of S&P 500 is greater than today's price, then we will buy the S&P 500 index, else we will have no position in the S&P 500 index.
Split the data
We will split the data into training and test data sets. In the training set, machine learning algorithms try to find and learn the patterns such as when to buy or sell.
Once the algorithm is done with the learning part, you will use the test dataset to evaluate the effectiveness of the model. We will use first, 80% of data for training and remaining data for testing.
Fit the support vector classifier
Next, we will define the machine learning algorithm. Here we will use a support vector classifier for prediction. We will use the fit() method on the training dataset to allow the support vector classifier to find the pattern. Here, X_train is the input features in the training set and y_train is the target variable in the training set.
Calculate the accuracy
We have trained the ML algorithm on the training dataset. We will then find the accuracy of the model on the train and test data set by comparing the actual values of the signal with the predicted values of the signal.
The accuracy is approximately 87% on the train data, and on the unseen/test dataset, it is 64%. The accuracy of 60% and above in the testing dataset is considered as a good model. So we will use the model in creating a trading strategy.
Strategy implementation
We will store the predicted signals and compute the strategy returns based on the predicted signal.

You can find this strategy in the Introduction to Machine Learning for Trading course on Quantra. You can create and add more input features, optimise other parameters of the support vector classifier algorithm and make it even a better strategy.
Live Trade on Blueshift through Quantra
Suppose you are satisfied with the strategy performance and think this strategy is worthy of your money.
What will be your next step? You want to take your strategy live, right?
Live trade basically means you connect your strategy to the broker. So whenever you get a signal, in this instance, let’s assume it is ‘buy’, an automated order is generated which is a buy order and it is placed with your broker.
But how do you take your strategy live?
On the Quantra courses, you will be provided with a readymade template which allows you to connect your strategy to the broker and live trade your strategy. You just need to click on the button and it will redirect you to a template strategy on Blueshift which you can tweak, optimise and live trade.
To get familiar with Live Trading Integration feature of Quantra, be sure to check out the following video that explains it in just around 2 minutes.
Can the strategy code created above be used as it is for live trading?
No. The code that you just created and backtested is in the vectorised format. Which means, you passed the historical data in a tabular format, computed signals and strategy returns on the entire data. This is computationally efficient and useful to analyze the initial effectiveness of a strategy idea.
But live trading requires coding in an event driven approach.
You can think of an event driven strategy as the explicit specification of when to call the core strategy. The strategy consists of fetching real-time data as input, generating trading signals and placing orders to brokers.
To convert the code into event driven format, you have to focus on following
- Import API methods
- Schedule the strategy logic
- Strategy logic
a) Fetching real-time data
b) Processing data and generating signals
c) Order placement
Let’s see how to write the above machine learning strategy in the event driven format.
Code the Strategy in Event Driven Format
1. Import API methods
The first thing we need to do is to import API methods and packages. Some of the packages you have already seen above. Along with that, we import some methods from the zipline library.
These methods will help you to fetch assets, schedule your strategy and place orders.
2. Schedule the strategy logic
The initialize method is used to define strategy parameters. This method is called only once when the strategy is started. And it takes context as a parameter. context is a special variable that is used to store user defined variables that are needed across different functions.
Inside the initialize method, you can specify the stocks on which the strategy will run. The symbol method can be used to specify single or multiple assets. You can also schedule the strategy logic inside the initialize function.
Scheduling the strategy is basically when you want to place the order or retrain the model. You can also define various parameters inside initialize which can be further used in the strategy.
3. Strategy logic
A. Fetch real-time data
Next, you need to fetch the real time data from the broker. This can be done using the data.history method. Here, context.security is the first parameter which stores the name of the symbol for which the data is required. Next are the data field and the lookback period for which you want data. Further, you need to define the frequency of data.
B. Processing data and generating signals
The processing of data and generating trading signals code remains more or less the same as you have used in the vectorized approach. If you observe, we haven’t changed a single thing in this part except the retraining of the strategy as scheduled in the retrain_model function, which is every month at the market open.
C. Order placement
Based on the trading signals and the accuracy score, you need to place the appropriate order to the broker. If the accuracy in the test set is not above 50%, we will not place the order. The order_target_percent API method can be used to place the order. There are other API methods which you can also explore.
That’s it, your strategy code is ready.
Analyse the Performance of the Strategy
You can obtain the detailed backtest for the strategy by clicking on the “New Backtest” button. Choose the dataset, start and end date and set the capital required.
The key performance metrics are as follows:

If you are satisfied with the strategy performance, then you can take the strategy for paper trading and then live trading on Blueshift itself by simply clicking on the live trade button.
If not satisfied, then you should tweak the strategy until the performance is acceptable to you in the backtesting. After clicking on the live trade button, you need to follow some steps before live trade starts.

You need to configure the risk management settings such as drawdwon limit, order and size limit. Select a broker, allocate capital and set the end date for strategy execution.
You also need to select the order confirmation mode. The automatic execution mode will automatically execute the trades when it gets a signal from the strategy. Some brokers allow one-click mode.
In one-click mode, the broker asks for user confirmation before placing an order. After confirmation, you will be redirected to the live trading console. The console has all the relevant information regarding your strategy in real-time.


Reference
Conclusion
In this article, you have learned how machine learning techniques can be used in trading. You have also created a trading strategy using support vector classifier and implemented the same in event driven format.
You have come across one-click live trading integration feature of Quantra. With this new feature, you can learn and improve your strategy and can take the strategy live without any download, all in one place. This feature is available in almost all courses of Quantra.
In addition to this innovative feature, the algo trading courses at Quantra provide a comprehensive learning experience, allowing you to seamlessly transition from theory to practical application. By enrolling in these courses, you can refine your trading strategies and directly implement them in a live trading environment, ensuring you gain valuable hands-on experience as you learn.
Disclaimer: All data and information provided in this article are for informational purposes only. QuantInsti® makes no representations as to accuracy, completeness, currentness, suitability, or validity of any information in this article and will not be liable for any errors, omissions, or delays in this information or any losses, injuries, or damages arising from its display or use. All information is provided on an as-is basis.